Introduction
E2E Networks nodes and load-balancers are monitored for commonly monitored parameters to ascertain server health in real-time. The information is graphically represented on the MyAccount portal. MyAccount also allows you to easily configure alert policies, set email notifications to enable you to respond quickly to critical situations when server health alerts are triggered. Overall it helps you in better planning and proactively resolving potential future problems.
In this guide, we’ll provide you information about where to see the monitoring graphs and how to set alerts through the MyAccount portal.
Login to MyAccount portal
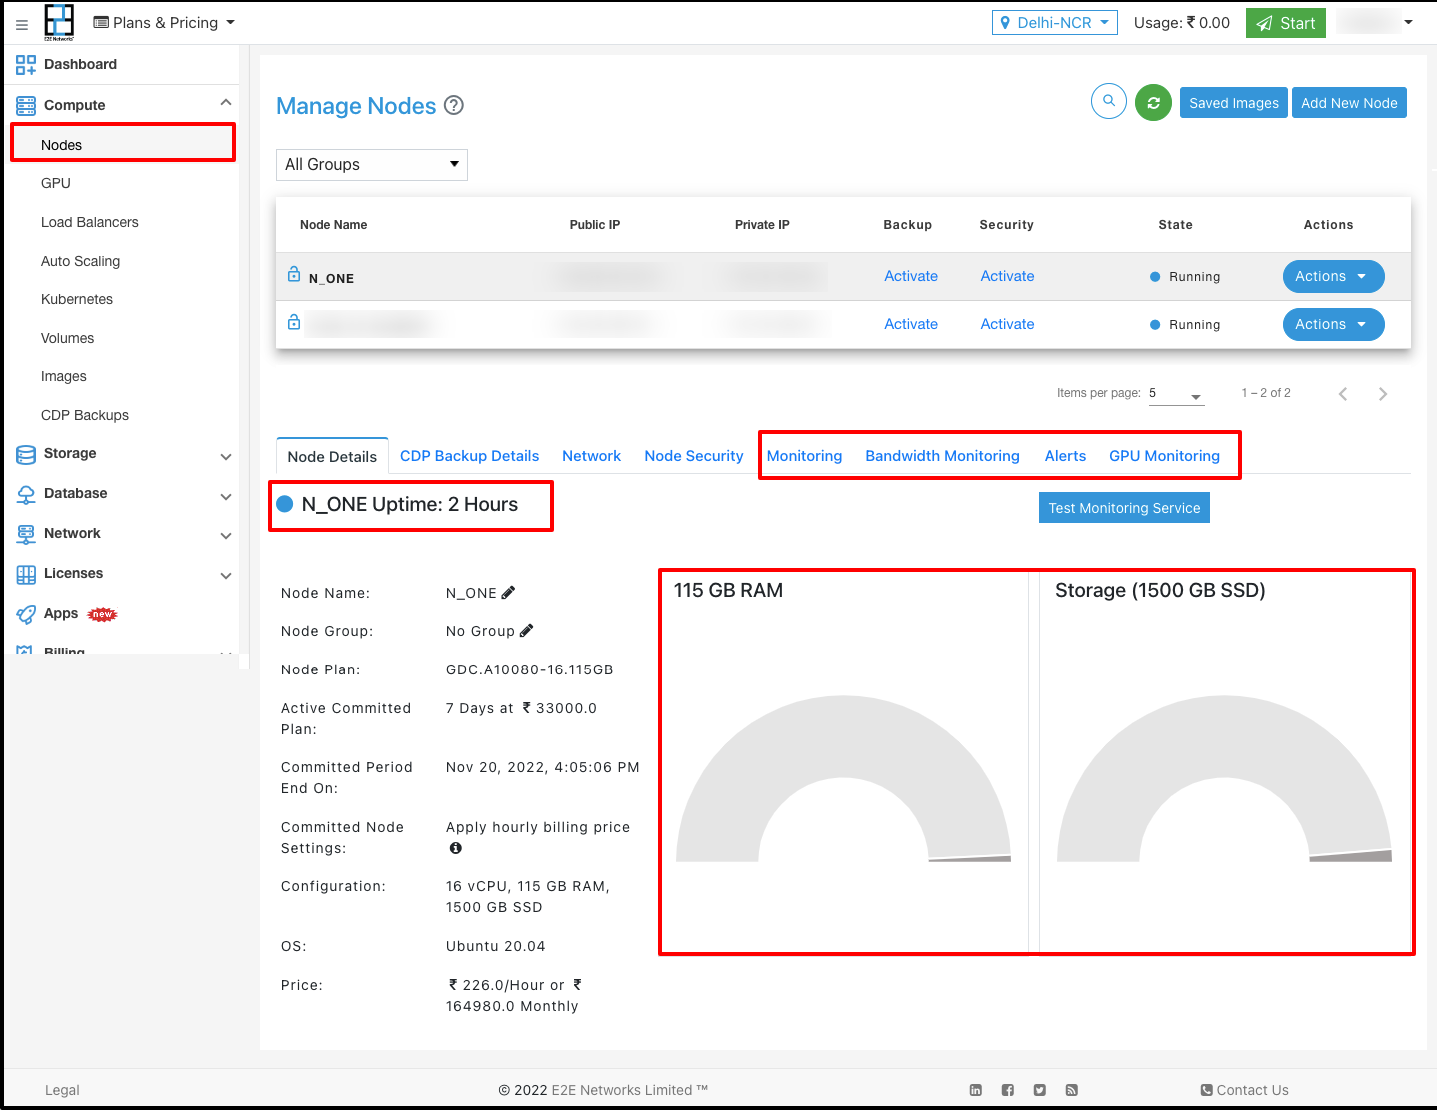
Once you are into E2E Networks My Account dashboard, select sub-menu ‘Nodes’ or ‘Load Balancer’ under the Products menu on the left side of your dashboard
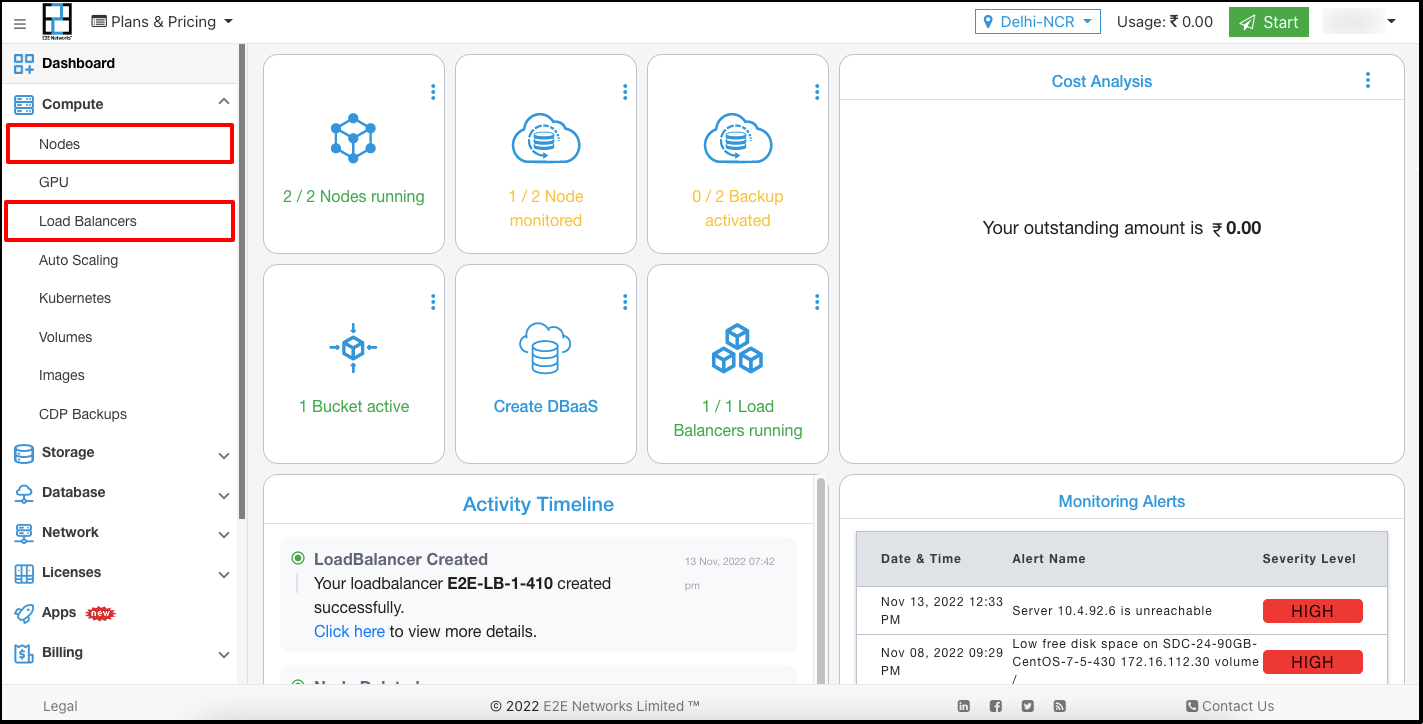
If you click on the node, you will redirect to the ‘Manage Node’ page. All your running nodes will be listed if there is no node then you can create an E2E Node.
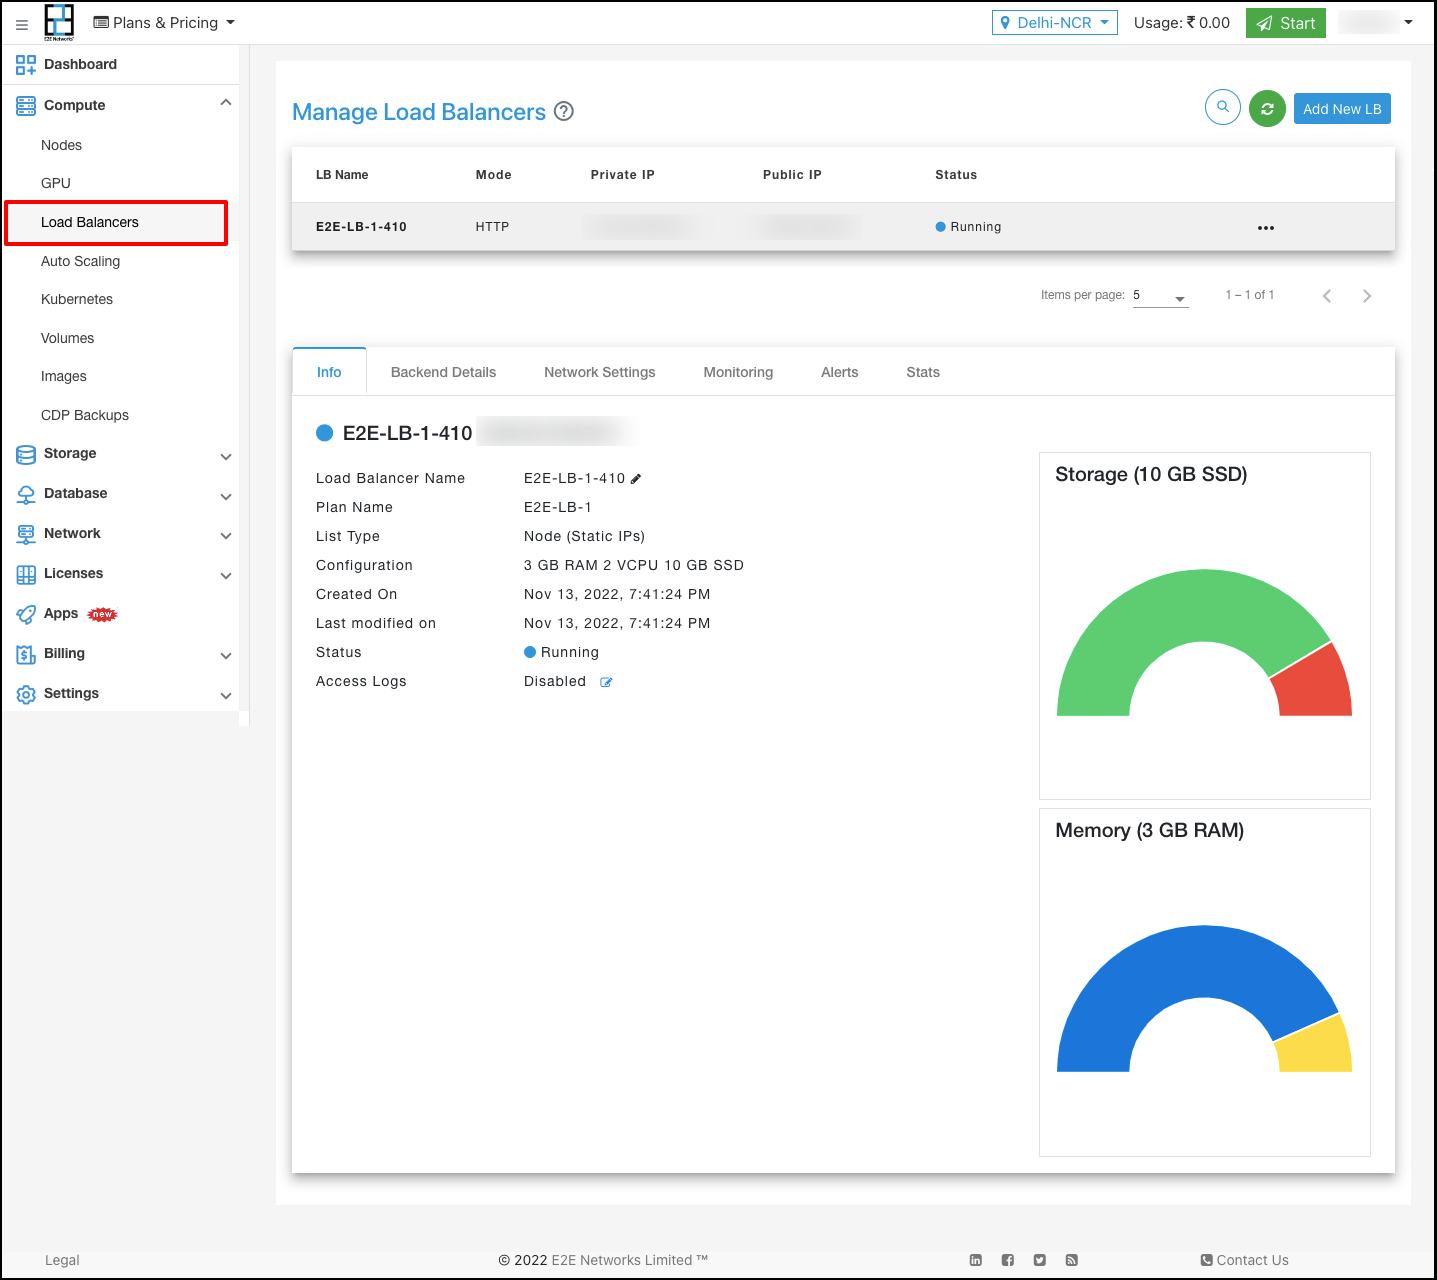
If you click on the load balancer, you will redirect to the ‘Manage Load Balancer’ page. All your running load balancer will be listed if there is no load balancer then you can create an E2E load balancer.
Monitoring Graphs
Monitoring of server health is a free service that provides insights into resource usage across your infrastructure. There are several different display metrics to help you track the operational health of your infrastructure. Select the node or load balancer for which you want to check the metrics
General Information
You can check the resource’s Disk and RAM information in the “Node Details” and “Load Balancer Detail” tab.
.
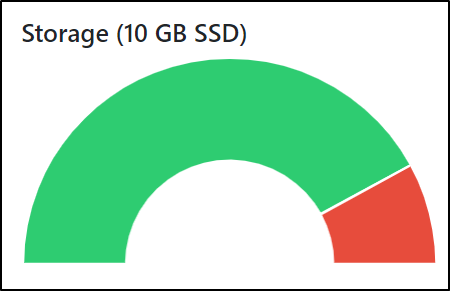
Disk Space
Monitor the overall used & free space on your resource’s disk.
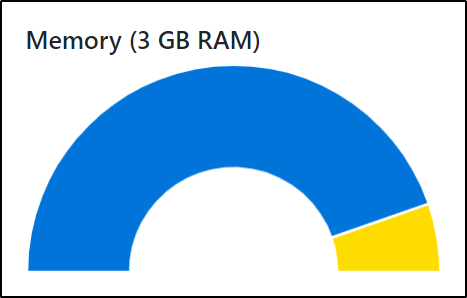
Memory Usage
Monitor the overall used & free RAM on your resource.
Click on the ‘Monitoring’ tab to check the CPU Performance, Disk Read/ Write operation, and Network Traffic Statistics
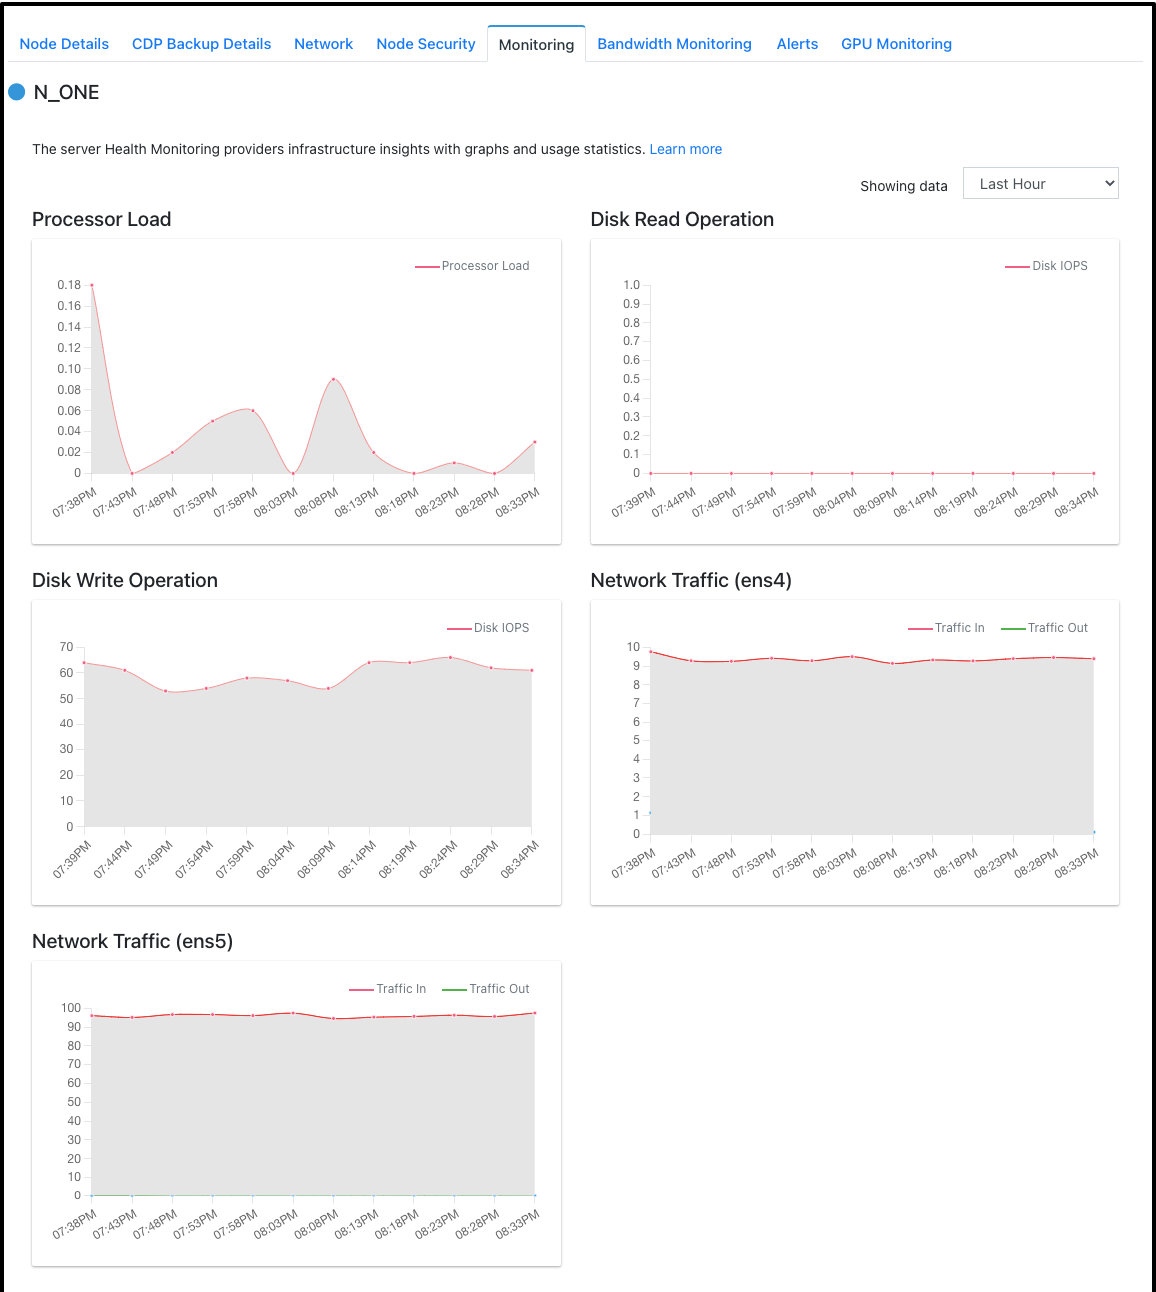
Processor Load
Processor Load expresses how many processes are waiting in the queue to access the computer processor—used to estimate system performance. It can vary according to the type and amount of computing task because some tasks require substantial CPU time which causes slow performance, errors and increase the load while others require less CPU time.
.
Disk Read Operation
Monitor the IOPS of disk read operation on your resource.
.
Disk Write Operation
Monitor the IOPS of disk write operation on your resource.
.
Network Traffic Statistics
View your network stats such as incoming & outgoing traffic of your private IP(eth0) & Public IP(eth1)
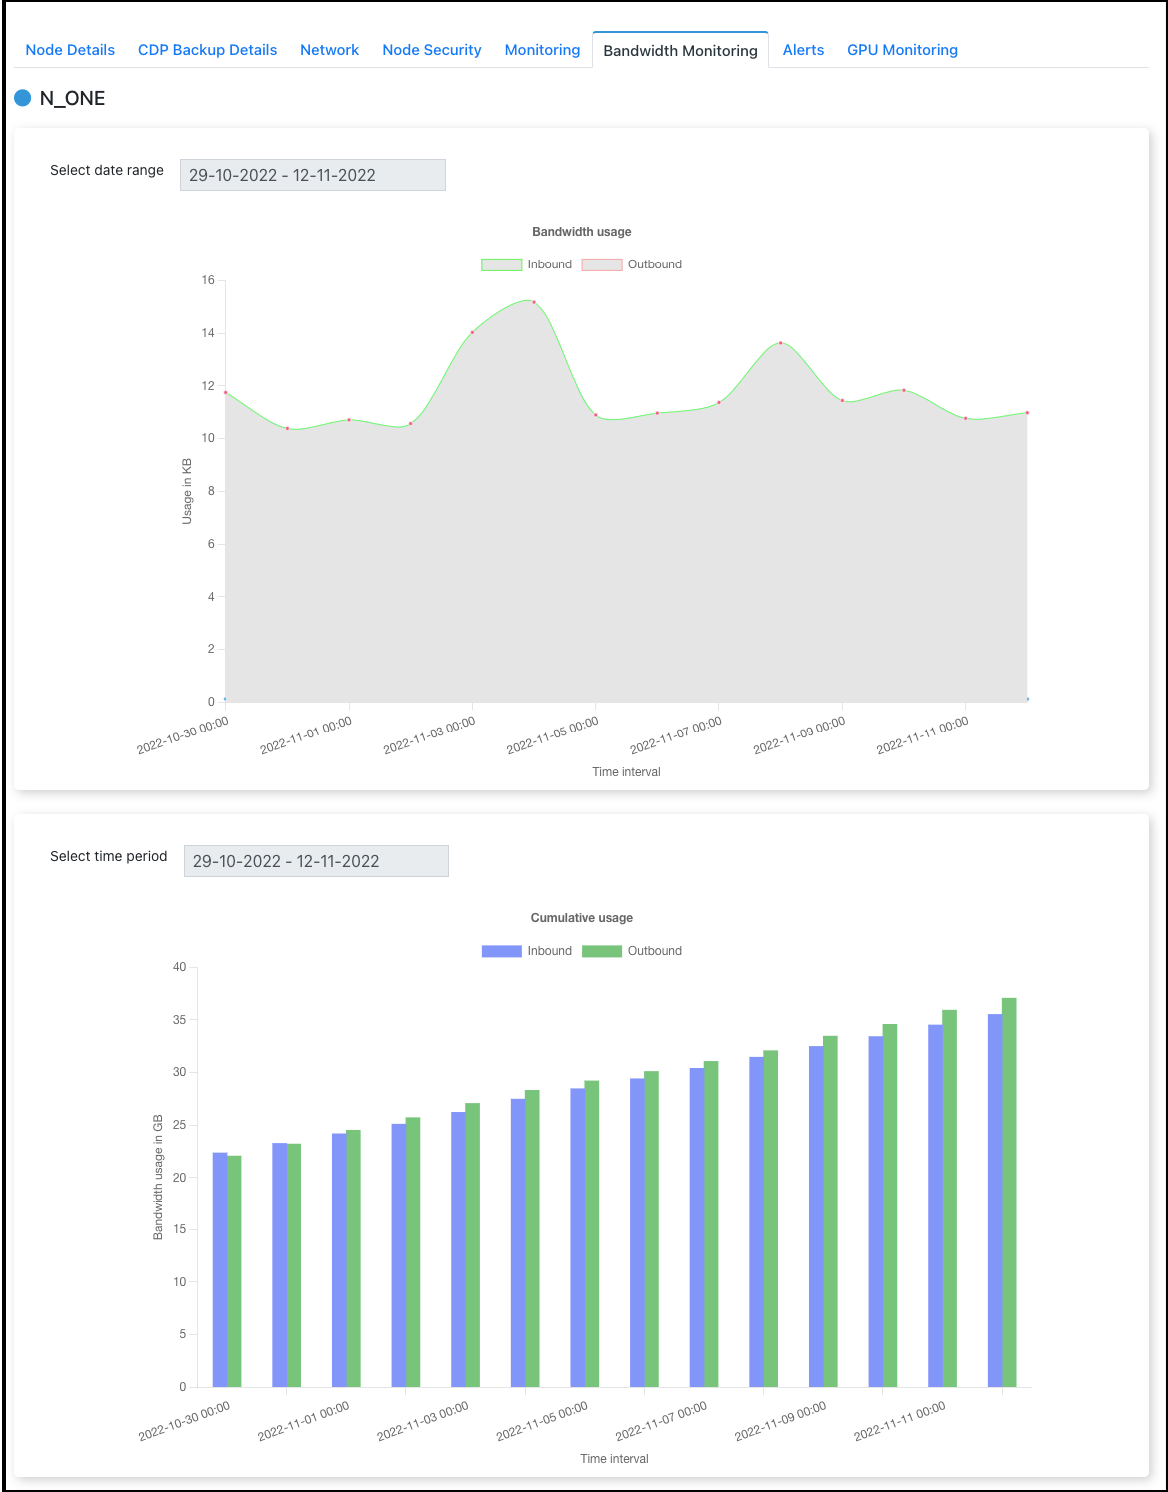
Monitoring Alerts
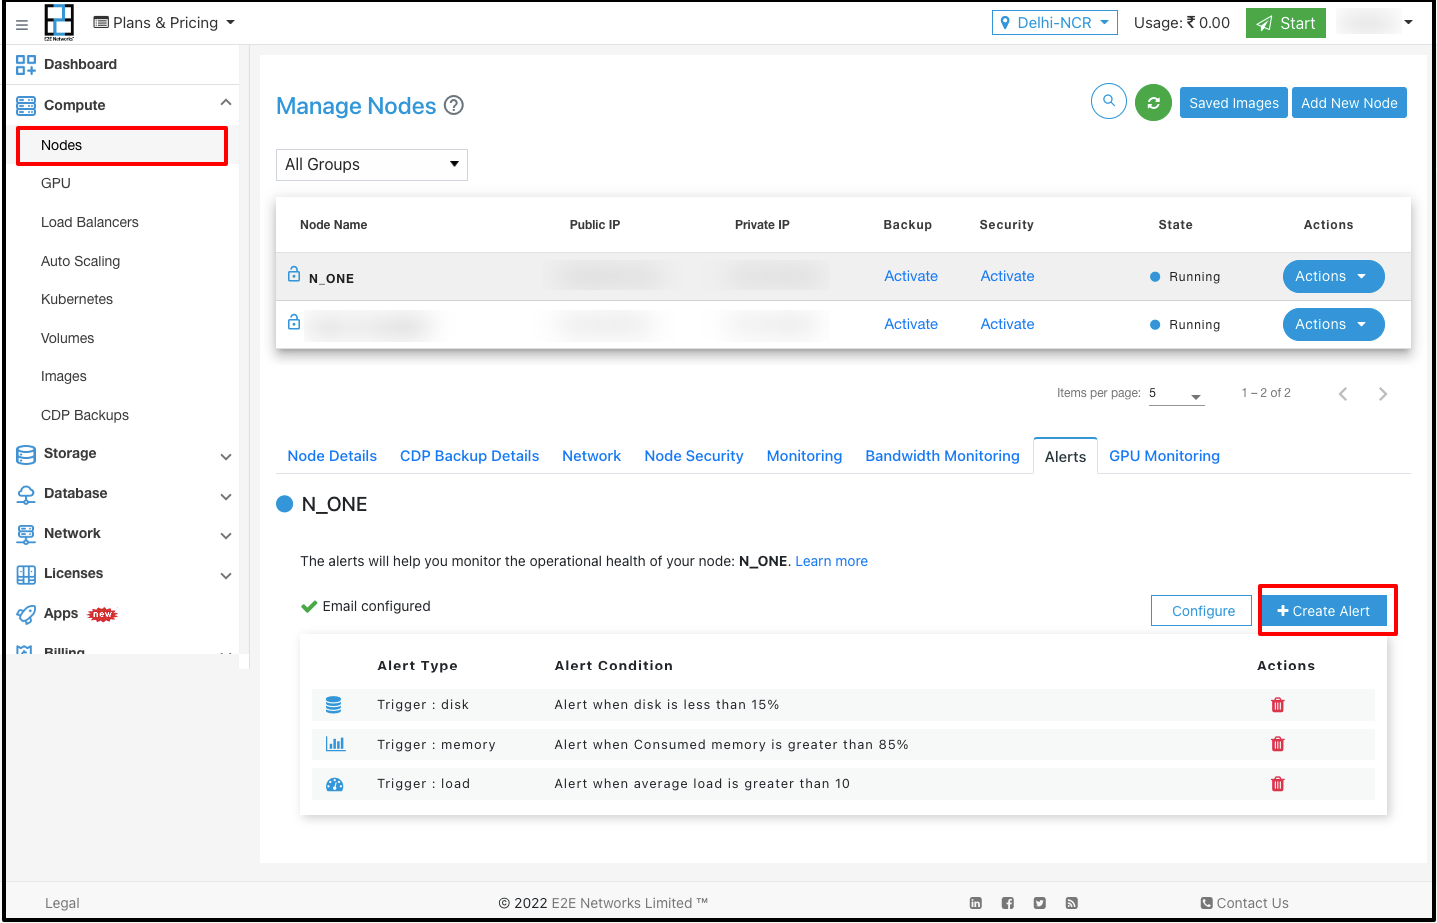
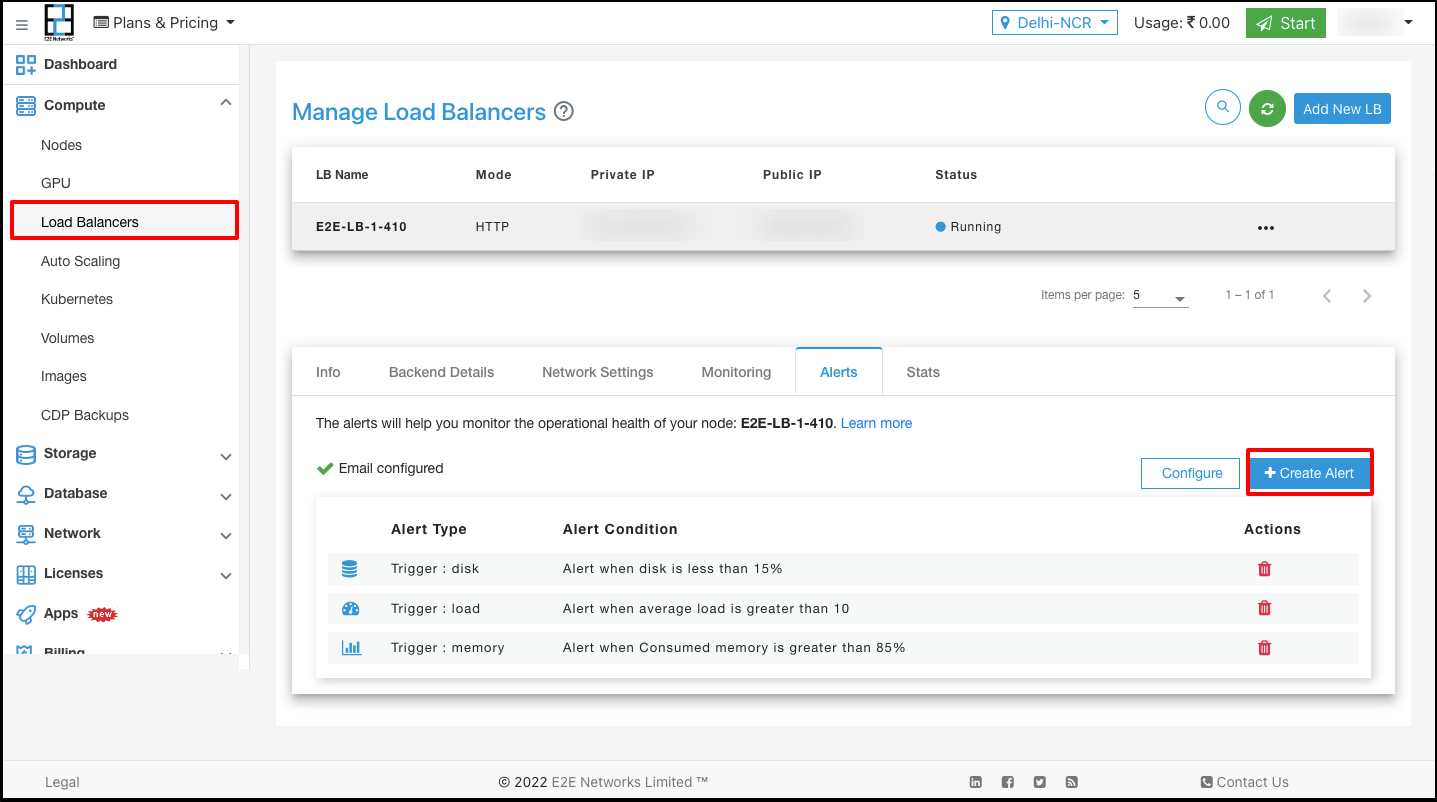
Server Health Alerts gives you the ability to create triggers about your server’s performance and resource utilization metrics which timely notifies you about any subsequent behaviour changes. For this, you need to specify the rules to receive notifications or invoke actions when there is any metric change to the underlying infrastructure. The alerting system works by sending automatic response notifications to a user-defined email list when the value of the metric relative to a preset threshold level changes. Server health alerts are default created for your newly created virtual node or load balancer using the following mentioned recommend parameters. Also, you can set up new alerts by defining trigger parameters as per your use case.
Setup Monitoring Alert for Node
Go to the “Manage Node’ page and select the node at manage node page (for which you want to set the monitoring alerts) and after that click on the ‘Alert’ tab.
Setup Monitoring Alert for Load Balancer
Go to the “Manage Load Balancer’ page and select the load balancer at manage load balancer page (for which you want to set the monitoring alerts) and after that click on the ‘Alert’ tab.
Define Trigger Parameters
You need to click on the ‘+Create Alert’ button to define trigger parameters and ‘Monitoring Alert’ window will open.
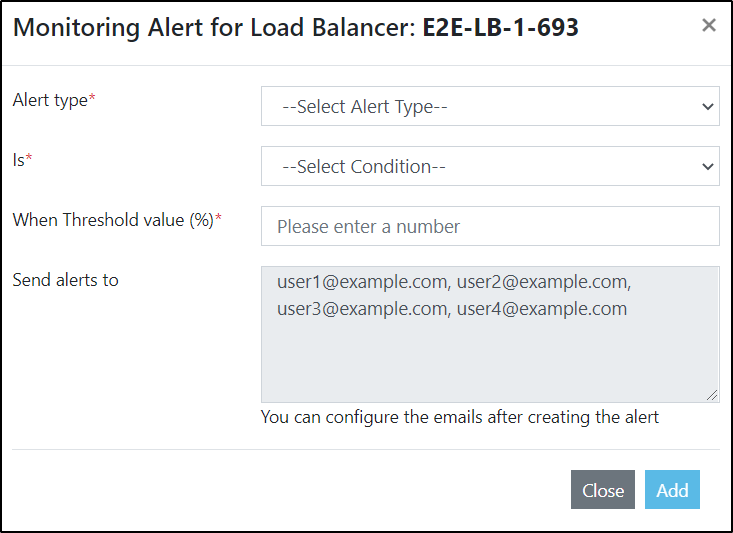
Select the ‘Alert Type’ for which you want to configure the rules.
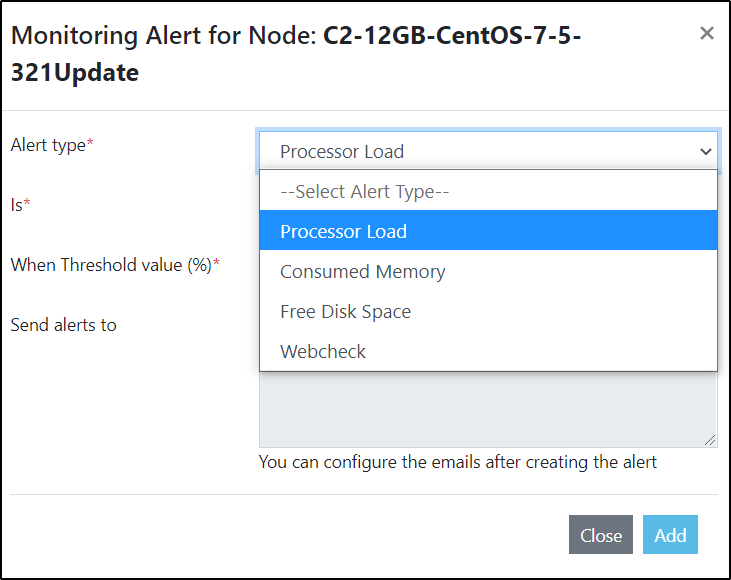
Processor Load - You need to set the Processor load threshold value (we recommend it should be >10) which would be used to decide on sending automatic response notification by comparing actual processor load of the node. It can be higher than, less than, equal to, not equal to a threshold defined value.
Consumed Memory* - You need to set the memory utilization level (we recommend it should be <15%) which is used to decide on sending automatic response notification by comparing actual free and memory utilization of the node. It can be higher than, less than, equal to, not equal to a threshold defined value.
Percentage Free Disk Space - You need to set the disk space utilization level (we recommend it should be <15%) which would be used to decide on sending automatic response notification by comparing actual disk space utilization of the node. It can be higher than, less than, equal to, not equal to a threshold defined value.
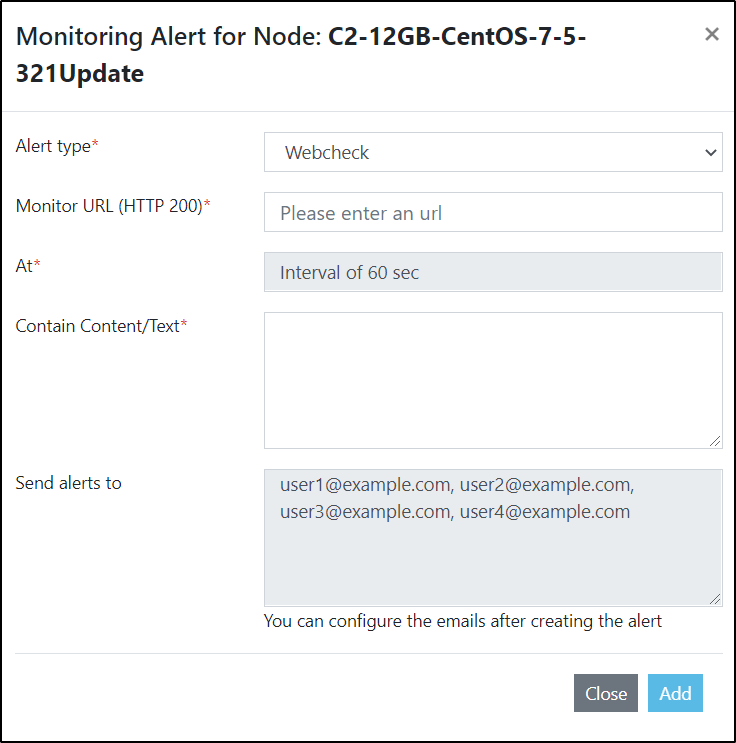
- Webcheck - Webcheck is a web URL monitoring tool which will create an alert on 2 conditions.
Success code 200 - The request was fulfilled. Text match - Webcheck program crawls on a given website URL and checks specific phrases of text on the website. If webcheck finds any changes different from the standard text then you will receive an email notification. Max Webcheck Limit - 5 URLs
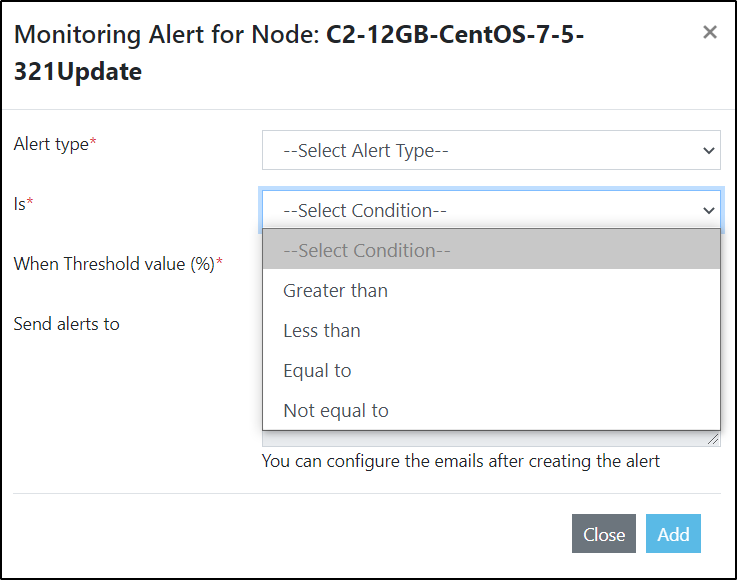
Then select the ‘Is’ condition, which can be set to trigger events.
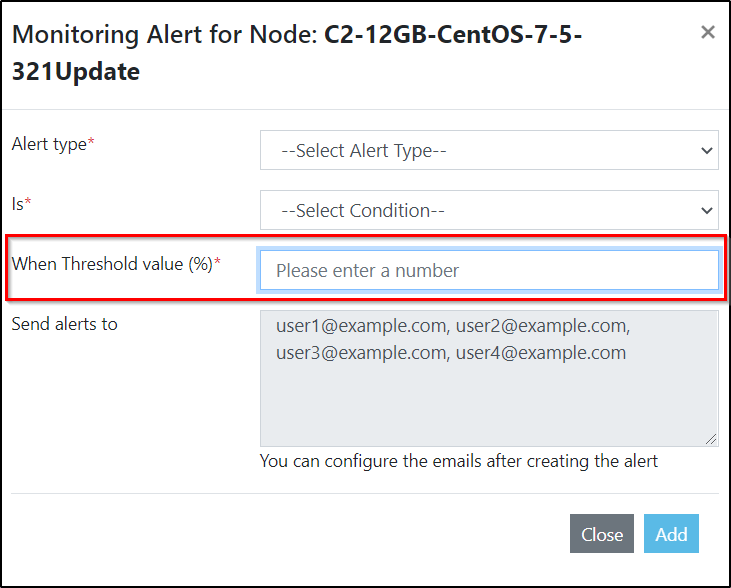
After specifying the above values, you need to define the threshold value ‘When threshold value (%)’. This threshold value will be validated and if the condition meets then an alert event is triggered.
Alert Contacts
The predefined contacts will receive email notifications based on the triggers.
Click on the ‘configure’ button to input the email addresses on which you want to send the notification alerts and ‘Configure service Alerts’ window will open.
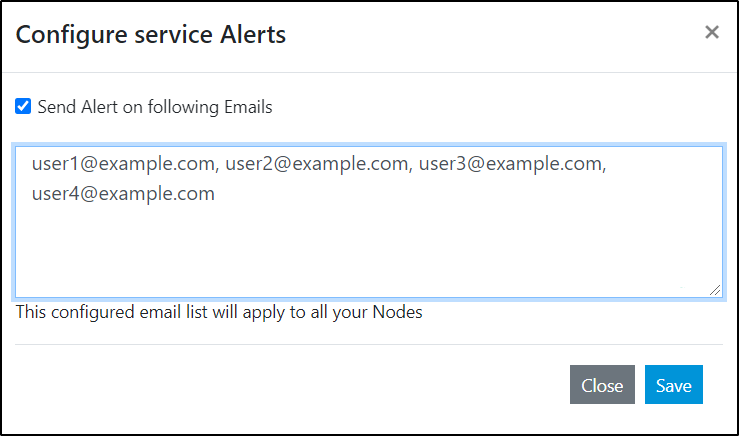
Enter the list of email addresses on which you want to send alerts. Note You can use these delimiters - comma (,) to separate multiple emails in a list.
Click on the ‘Save’ button to save the list.
In case an alert condition is met then the emails entered will receive a notification. You can easily manage the Emails on which you want to send the alerts by simply adding or deleting them from the list.
Troubleshooting Steps if the Monitoring Data is not visible
All E2E Nodes are Pre-configured for Monitoring by default, This data are available to you on the Monitoring section In Manage Node page. Post Launching your Nodes, You will be able to view this data within 5 to 10 Minutes.
Sometimes, This data might not be visible to you or might stop seeing the data completely from the Monitoring Dashboard. In this article, we will share with you some of the common steps to troubleshoot the issue to fix this issue from your end.
Step1: Make sure Zabbix-agent is running
E2E Nodes by default are configured for Monitoring via Zabbix-agent. This agent will be running on your server when you Launch your Nodes, You need to make sure this agent is running all the time so that your servers are being monitored continuously
You can check the status and Verify it by running below command
service zabbix-agent status
If you see service has been stopped for some reason, Please start the service with below command
service zabbix-agent start
Step2: Zabbix Port should be opened on your server
Even if the Zabbix-agent is running fine on your server, the E2E Cloud Monitoring server should be able to Fetch the data from your server to display in Myaccount Portal. You need to verify and Keep Open the Zabbix-agent Port 10050 to E2E Cloud Monitoring server (172.16.103.23)
To open the Zabbix port 10050 to the E2E Cloud Monitoring server, Please use the below command.
sudo iptables -A INPUT -p tcp -s 172.16.103.23 --dport 10050 -j ACCEPT
Here we use Iptables which by default installed and configured on E2E Nodes If you have configured some other firewall you need to open the port accordingly.
Once the above command is run, You need to reload IPtables rule, Please refer below and use the appropriate command as per your OS.
On Ubuntu 14.04 use the following commands to save/reload the iptables rules
sudo /etc/init.d/iptables-persistent save

sudo /etc/init.d/iptables-persistent reload
On Ubuntu 16.04 and Ubuntu 18.04 use the following commands
sudo netfilter-persistent save

sudo netfilter-persistent reload
If you are using centos, Use Below command
service iptables save
Apart from Above steps, You will also not be able to view the Zabbix data on the below scenarios
Custom Image
Your Node is powered off
Your Node is Unreachable
Zabbix-agent service has been uninstalled on your node
Manual Changes made on Zabbix Configuration from your end.
Conclusion
You will now be able to view the data on Myaccount Dashboard. If you are still facing any issue, please raise a ticket to our support team on [email protected] who will help you resolve the issues.
